SQLWATCH comes with a number of pre-defined checks, real-time actions, real-time notifications and reports. Adding a new check and report is as simple as defining the query we want to use for the check, and the query we want to use as a report. It is also possible to create more complex reports. This is the most complex SQLWATCH module so far.
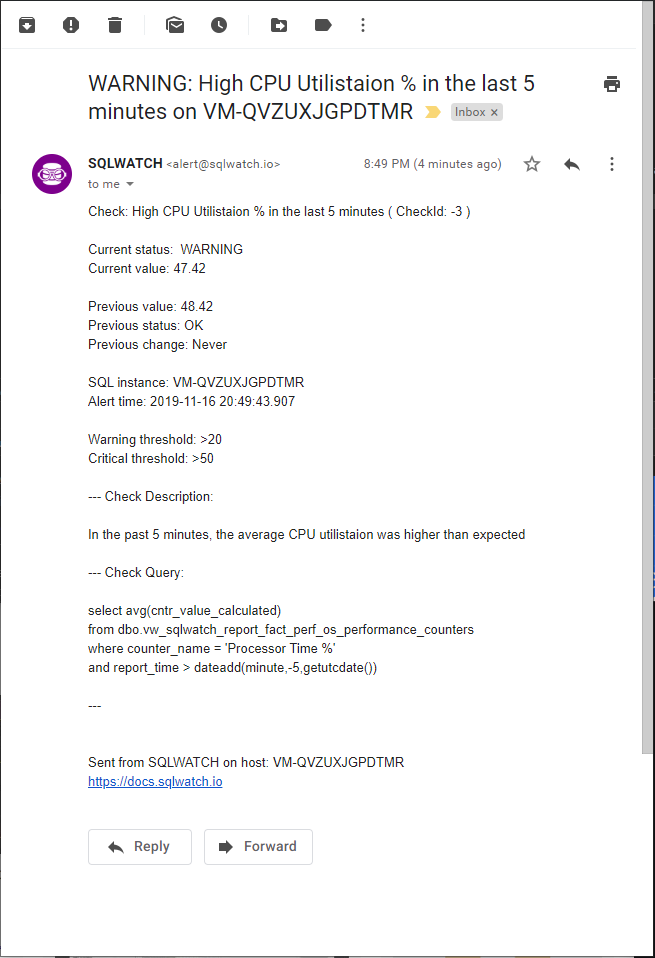
High CPU Alert simple check 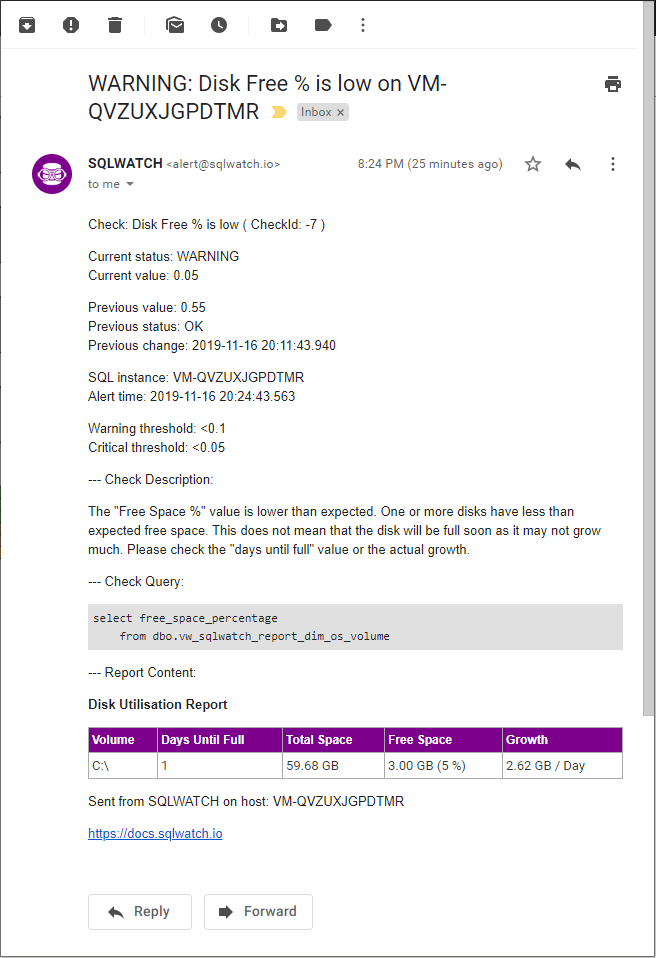
Low Disk Alert with Report 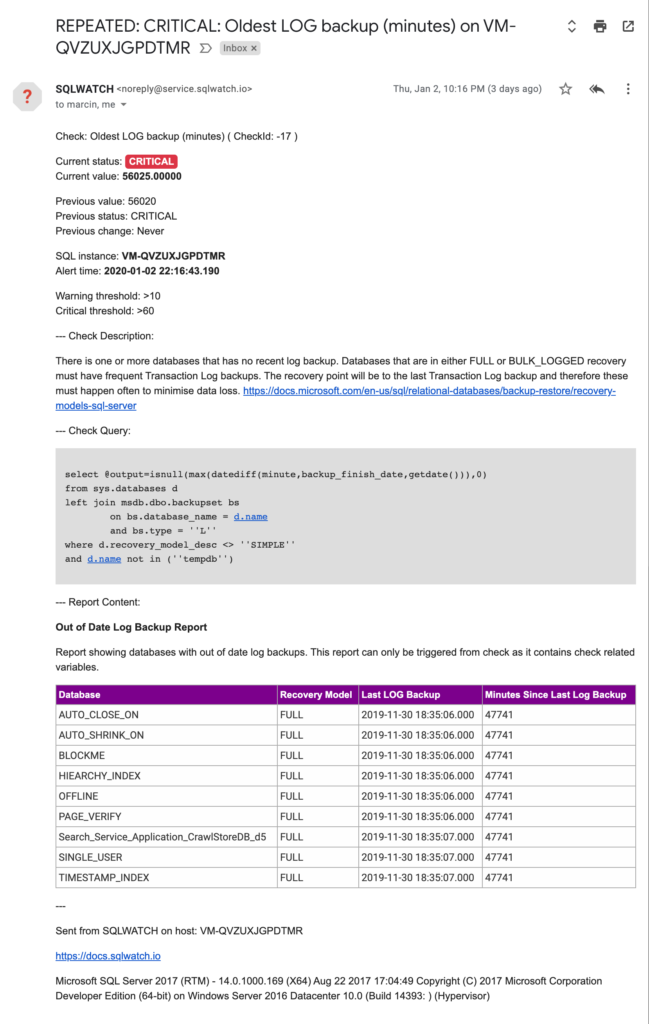
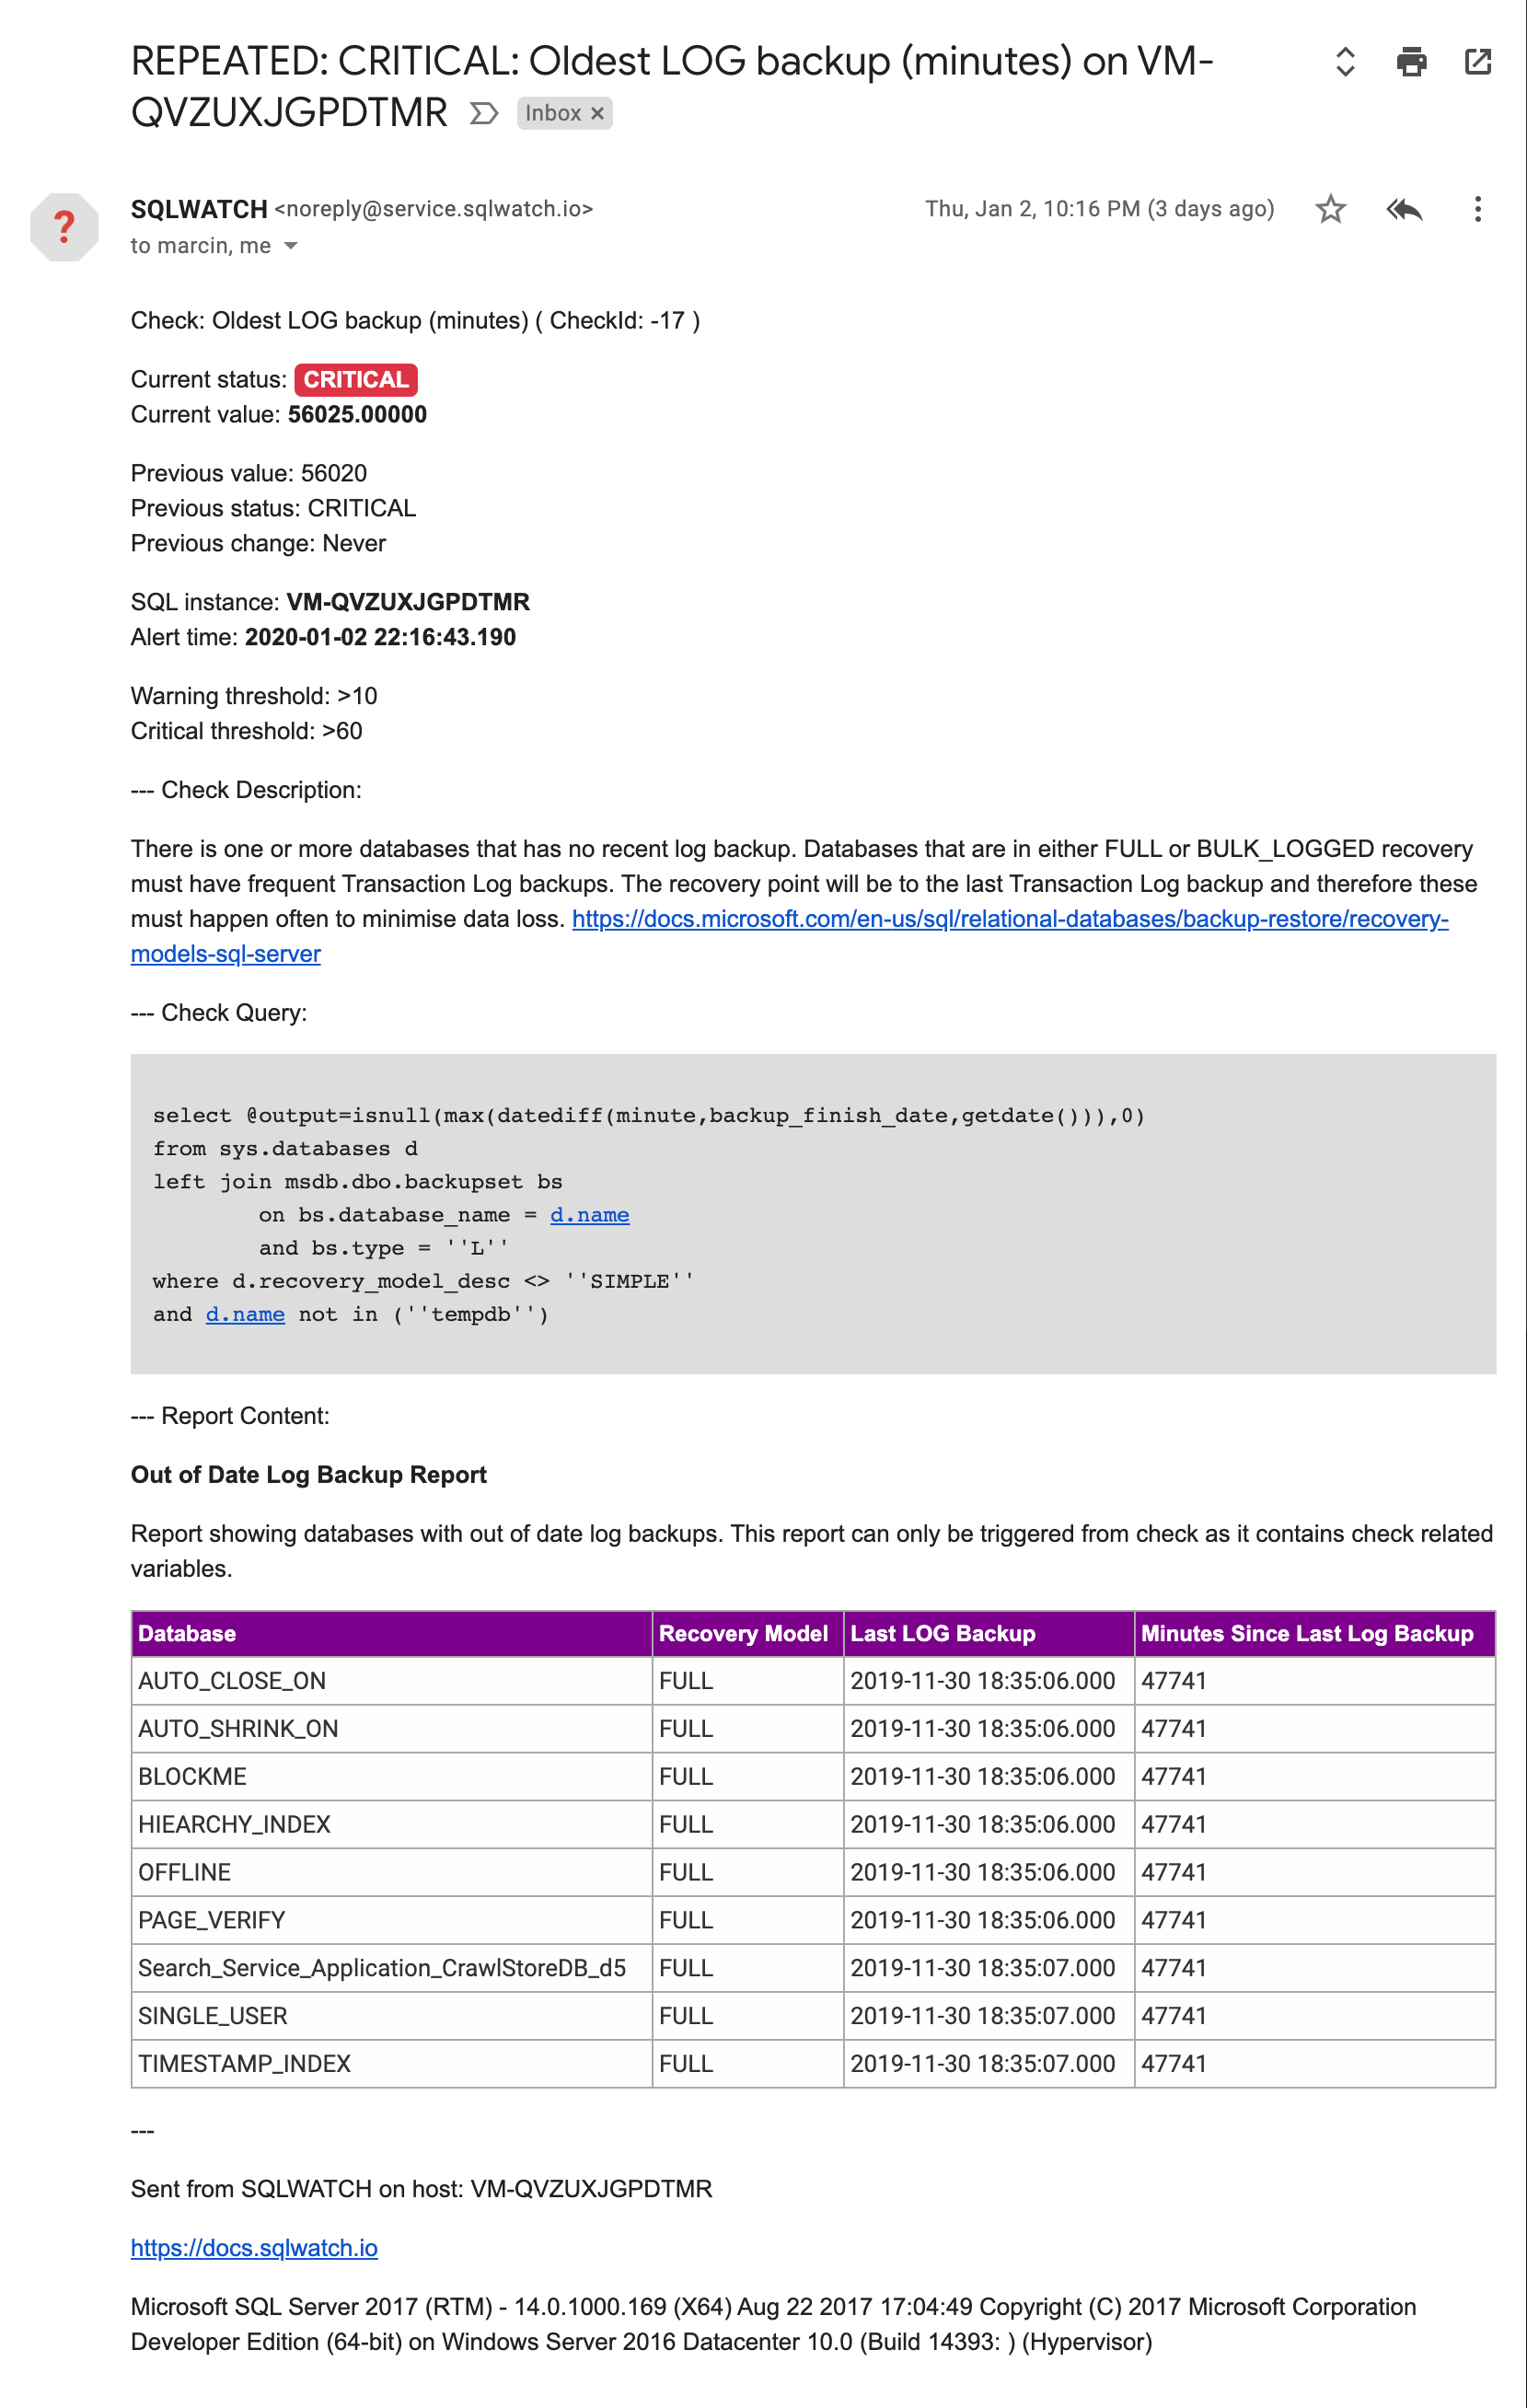
Log Backup report 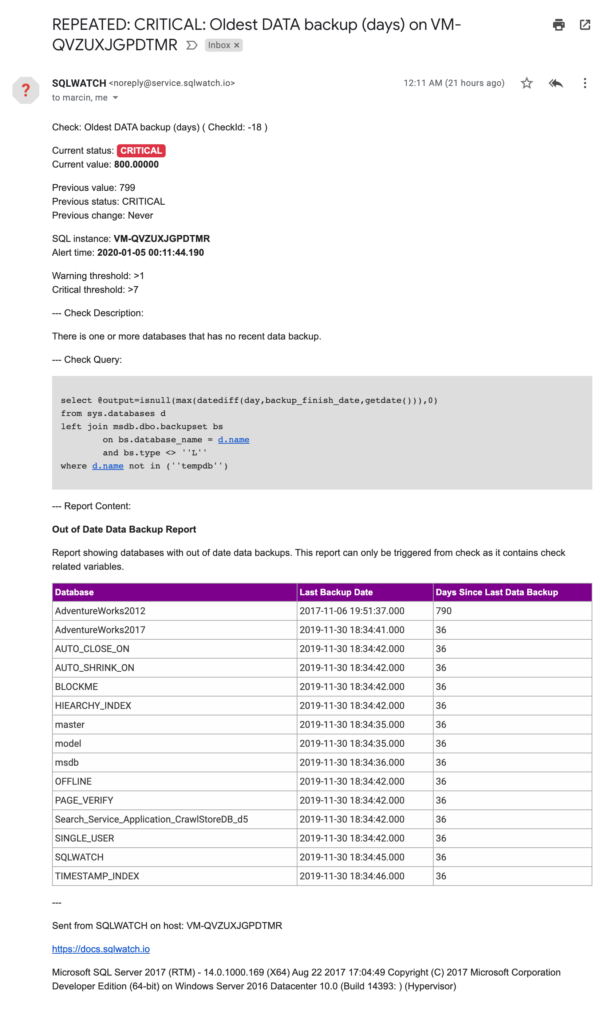
Backup Report 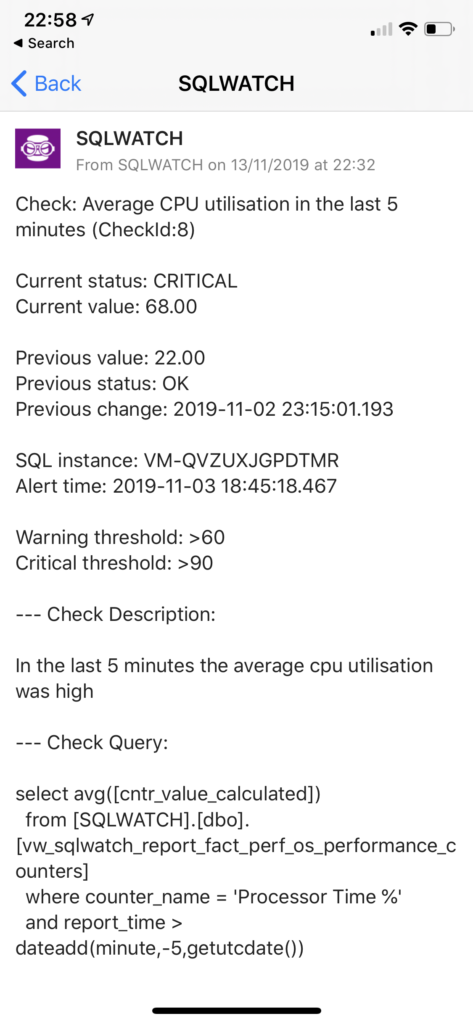
Pushover notification 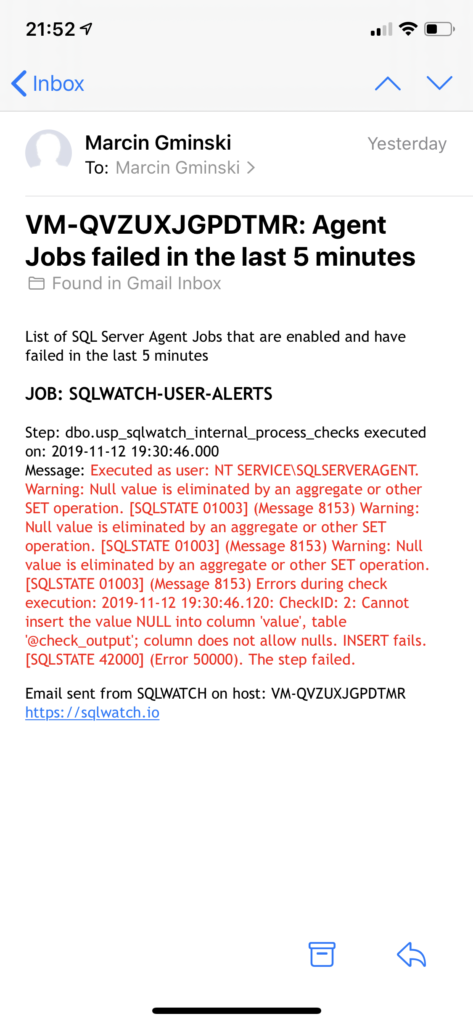
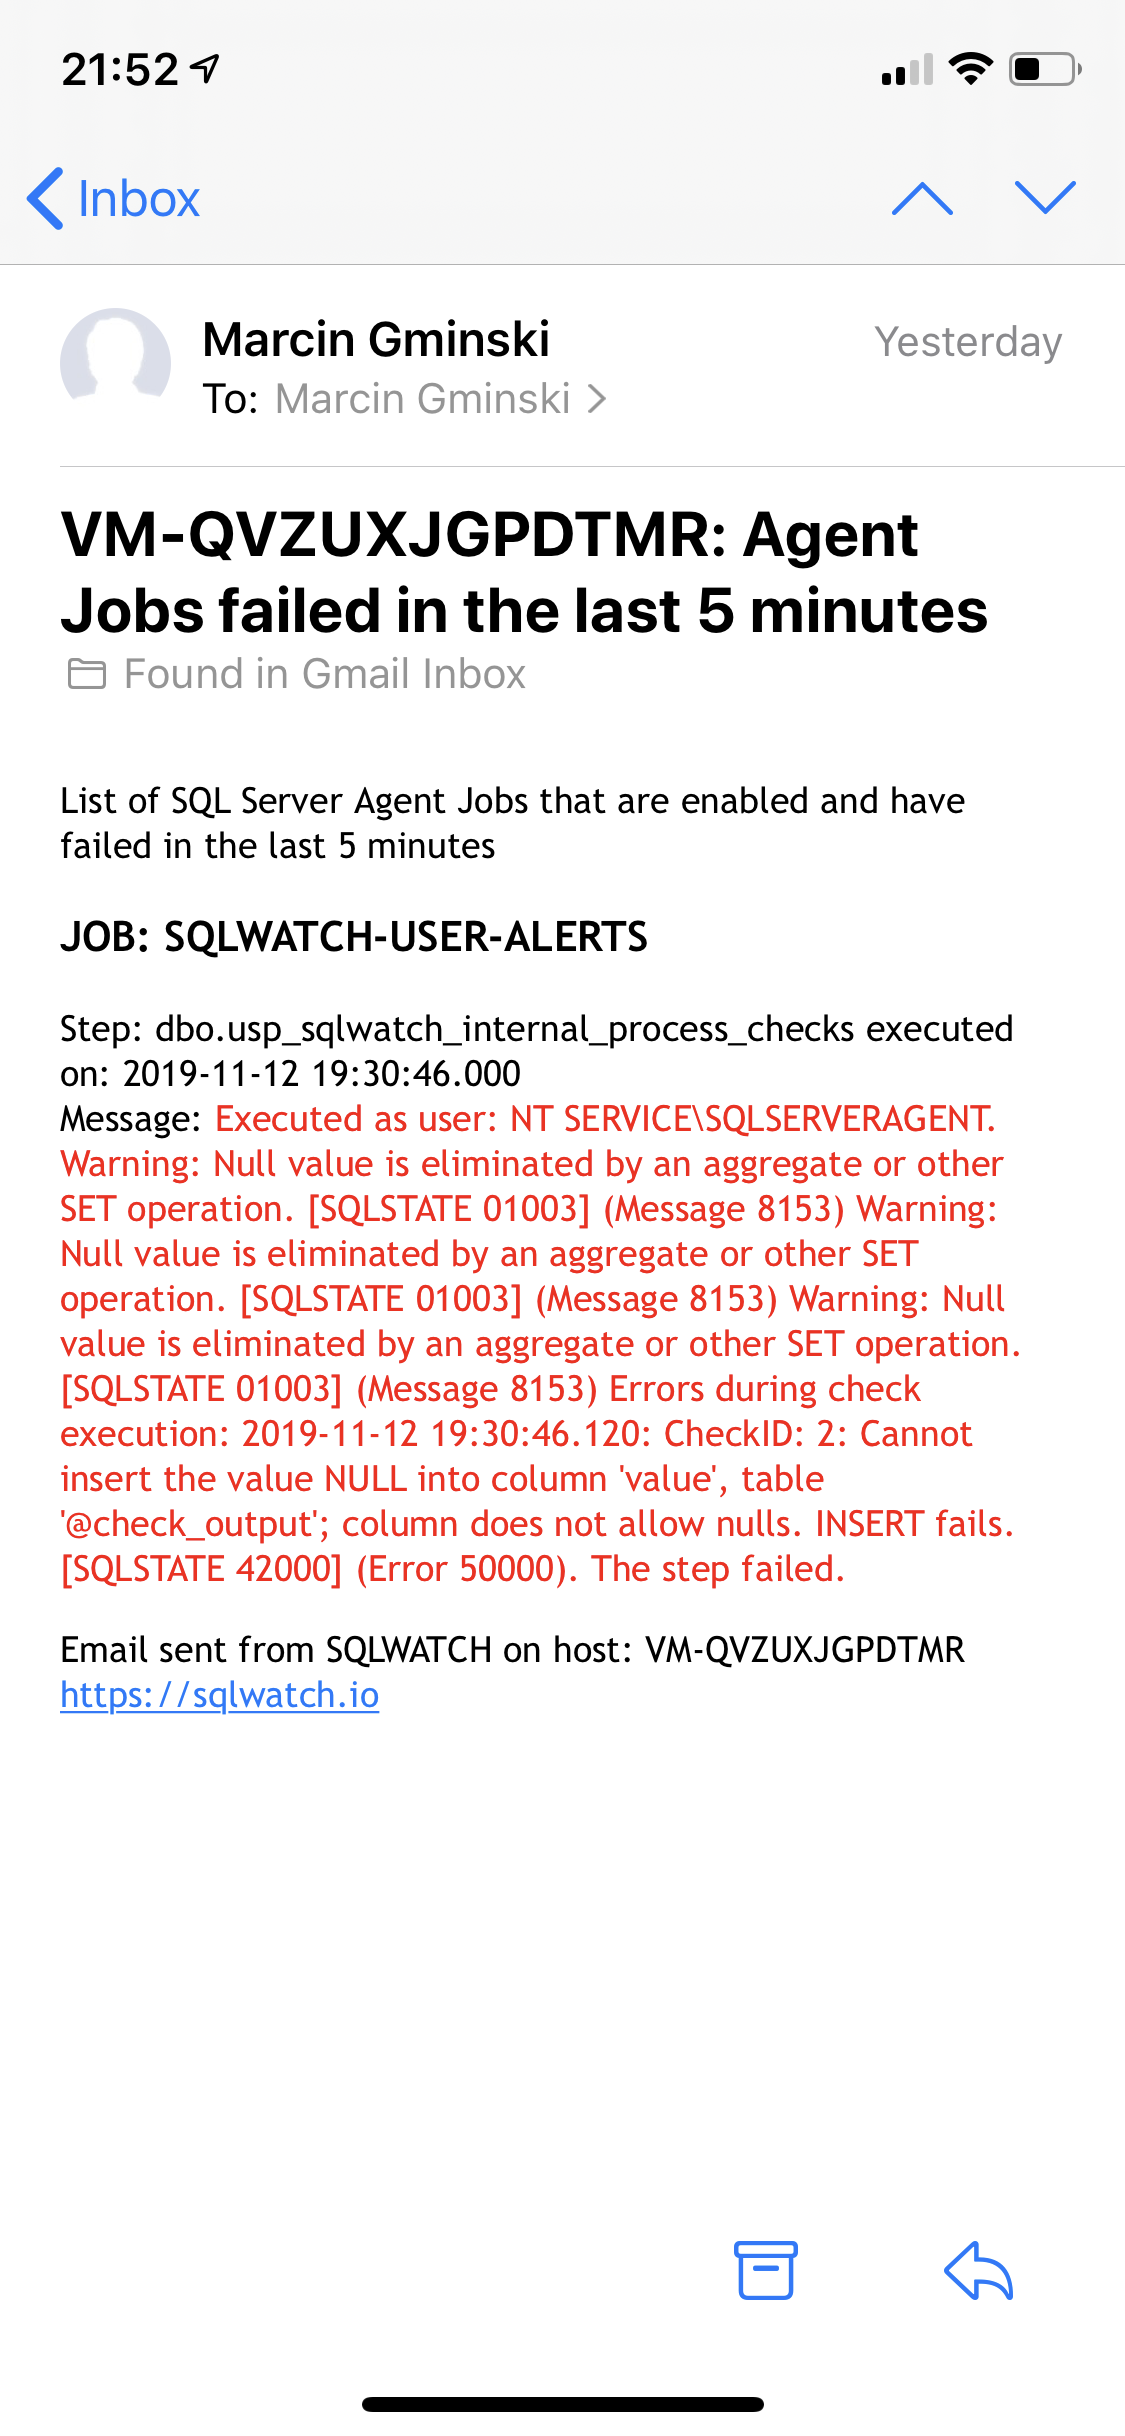
Agent Job Failure Alert 
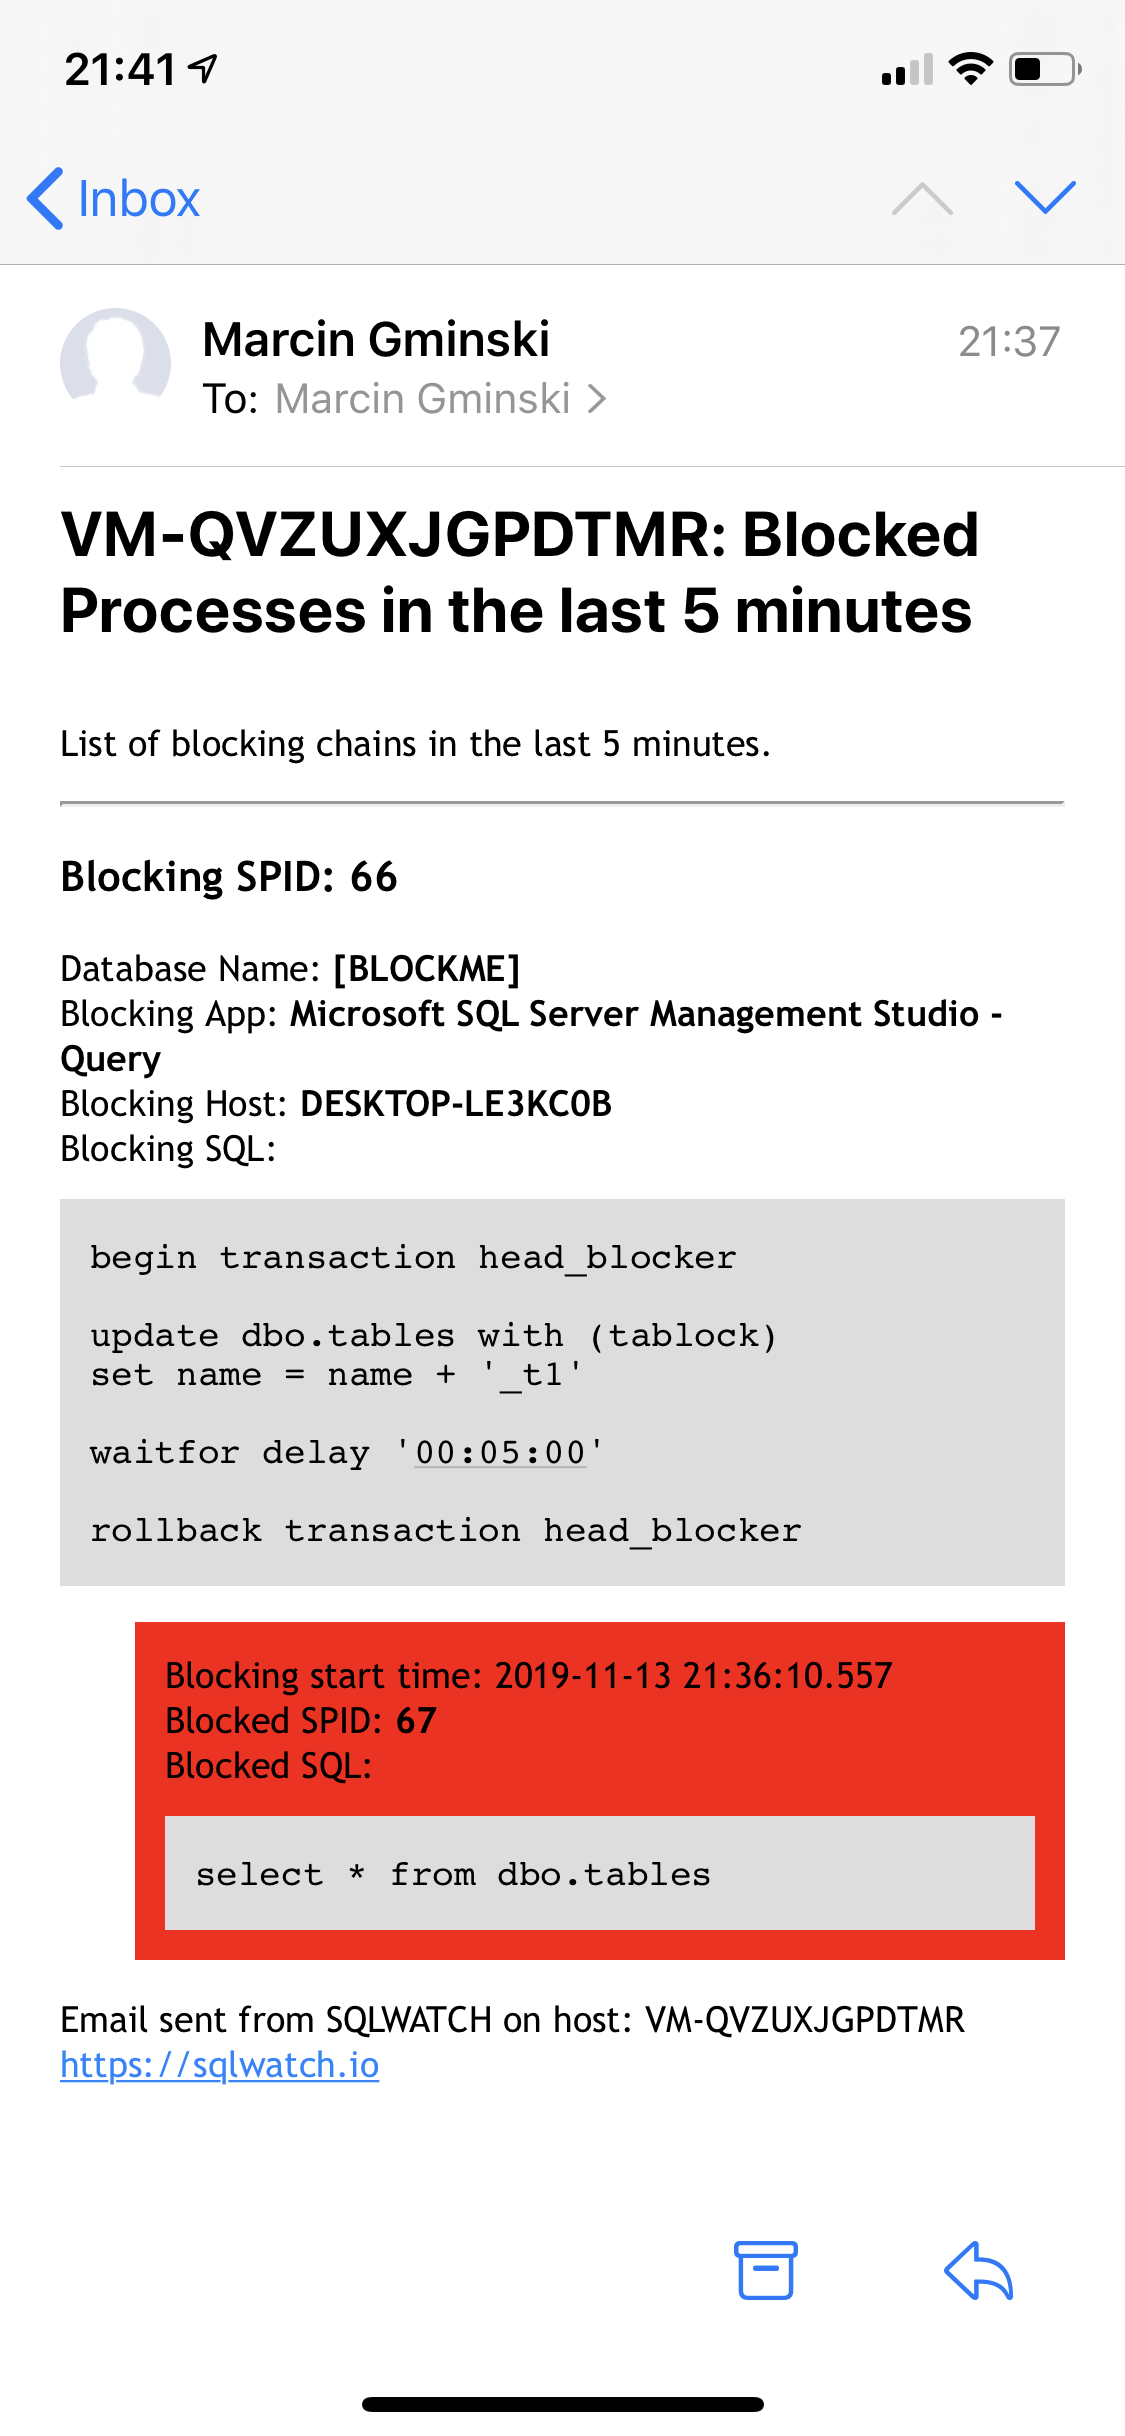
Blocking Report 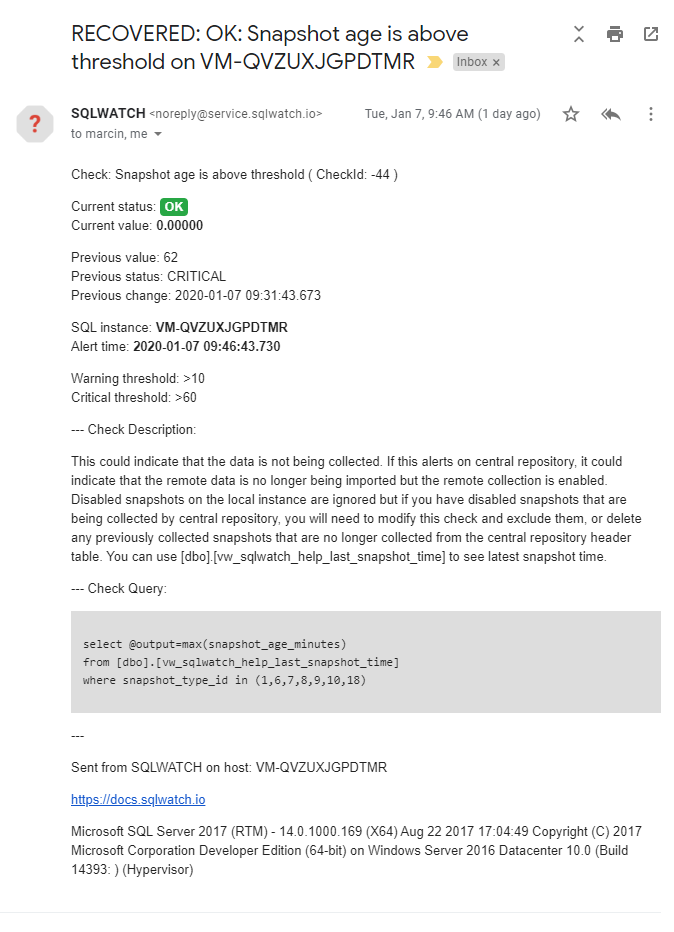
Recovery Message


Recovery Notification
SQLWATCH Can also detect and notify about a recovery scenario, where a previous error returns to normal – for example, an intermittent has resolved itself, a job re-ran and everything came back to normal and you can go back to sleep.
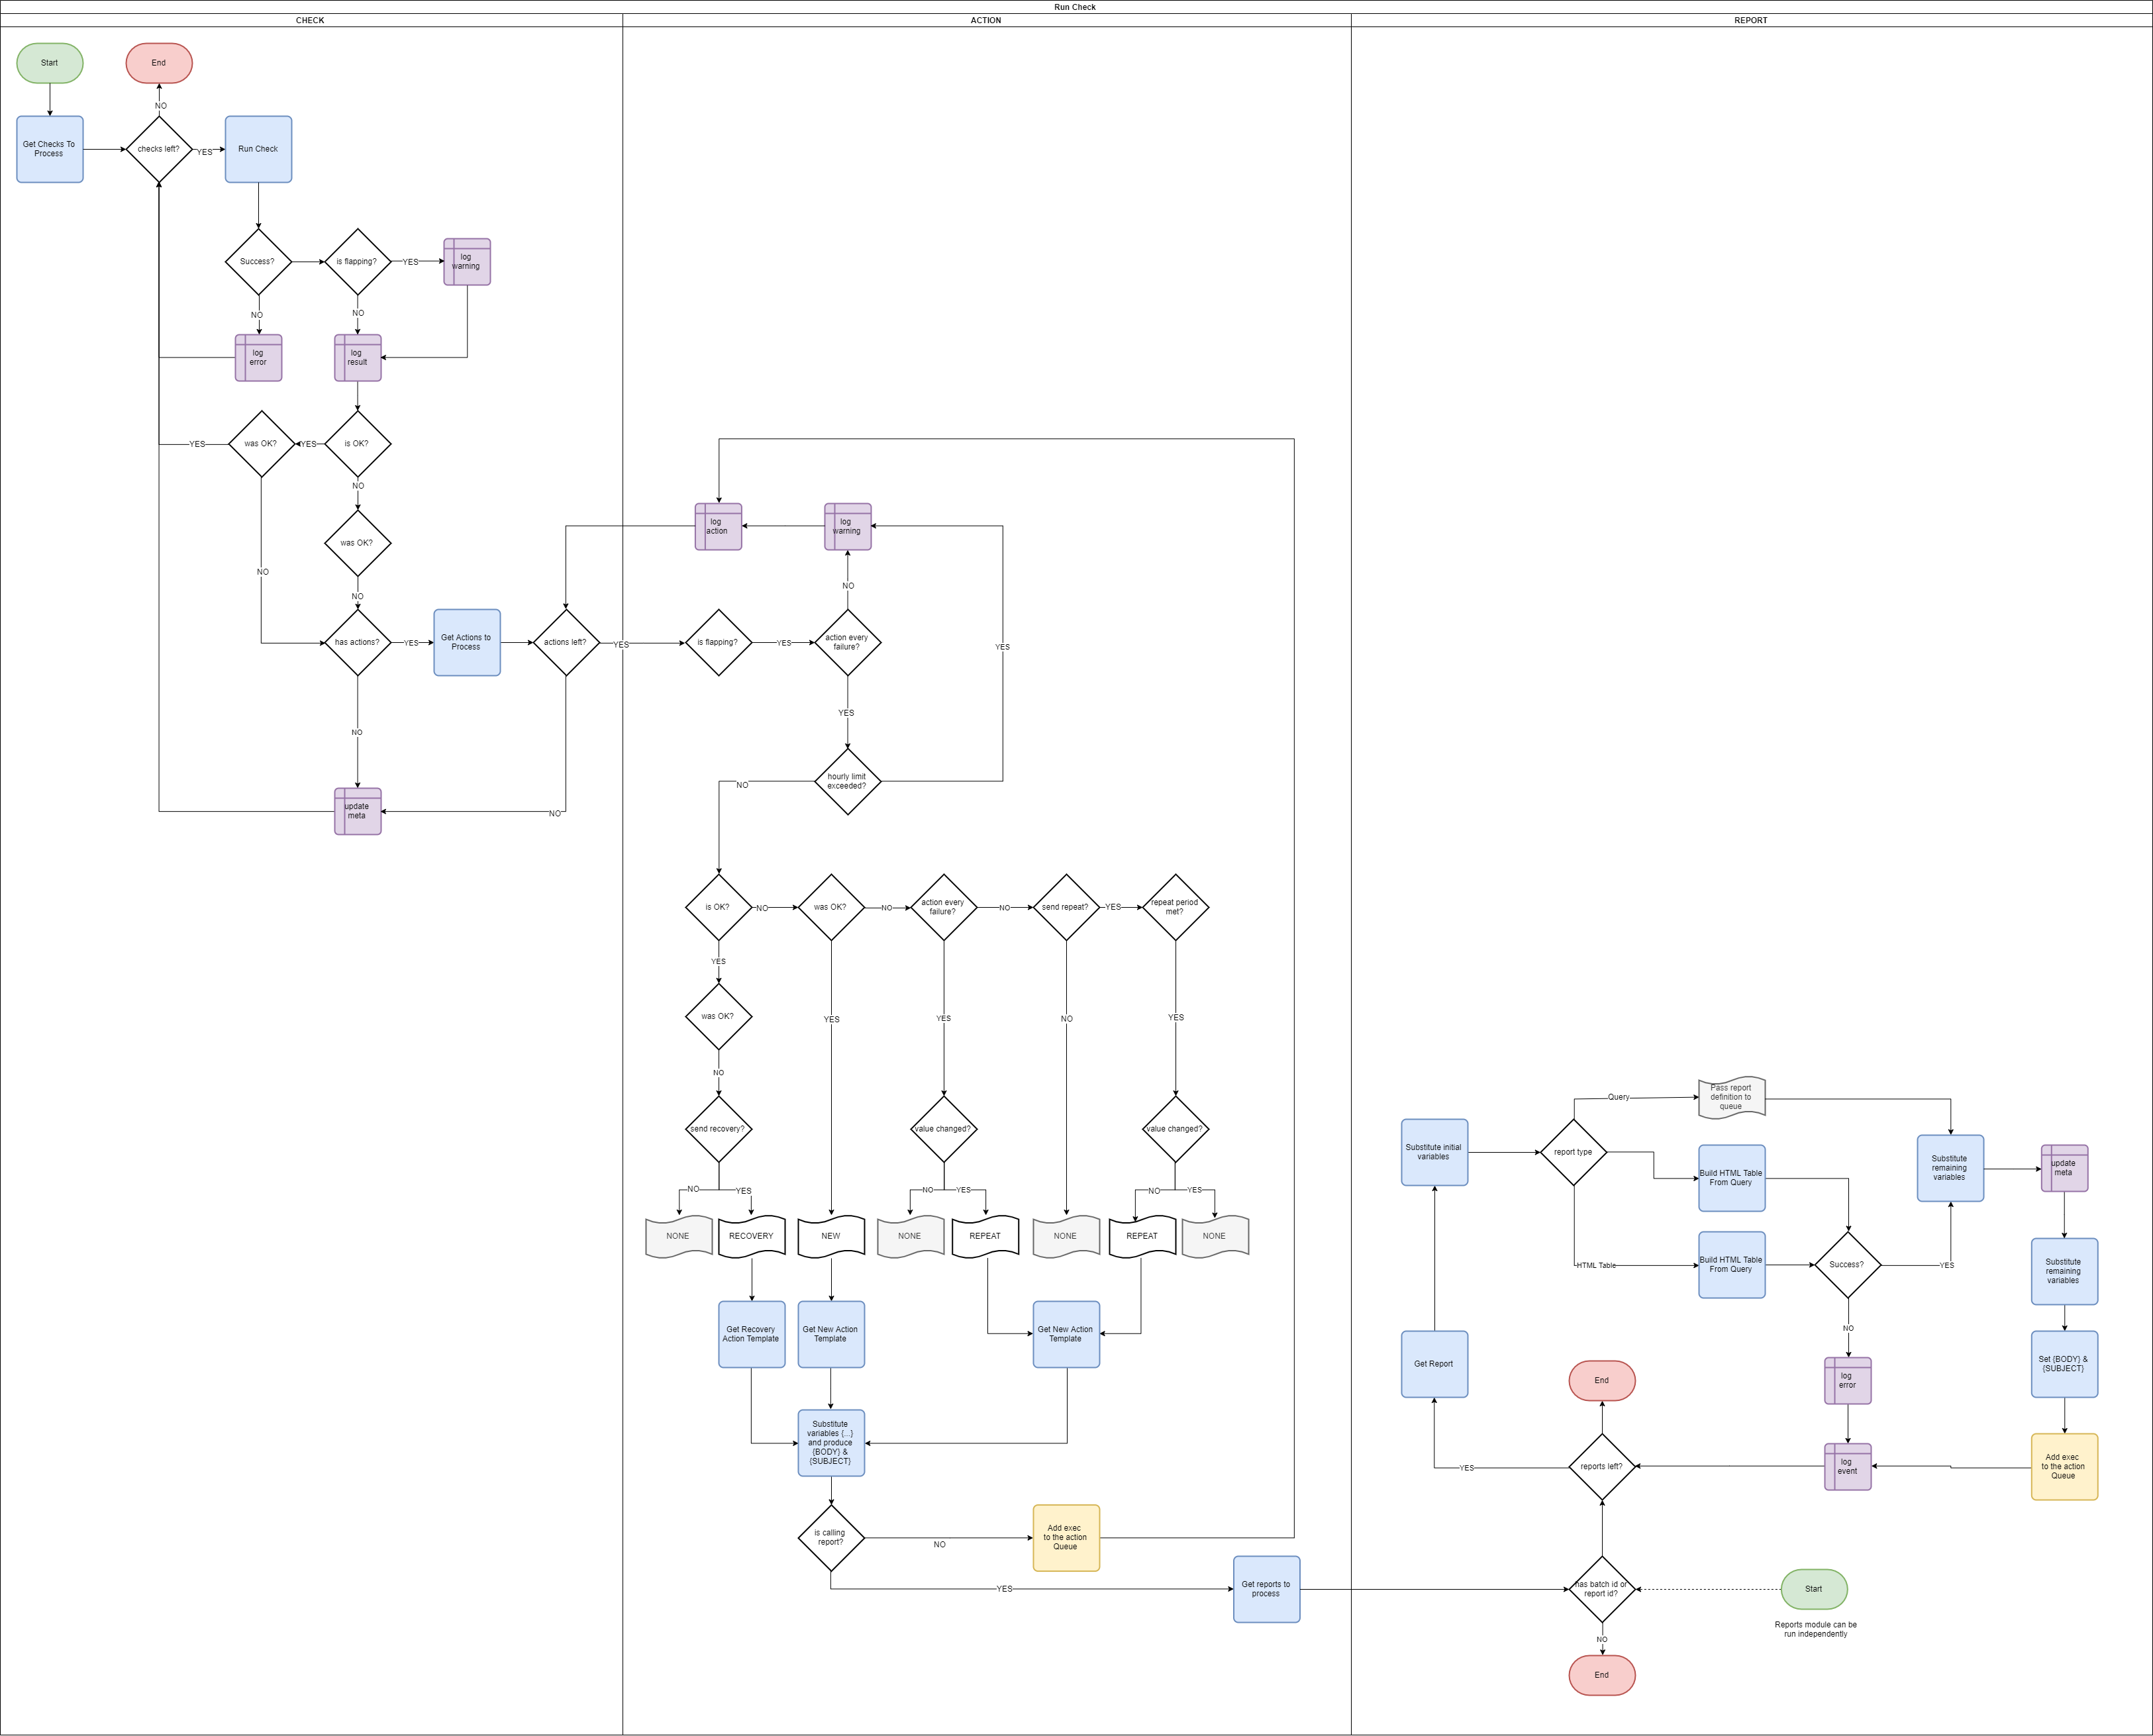
How it works
Checks
Checks are the core driver of the action mechanism. When the check goes from the OK status to WARNING or CRITICAL it can optionally trigger action and notification.
Checks are very lightweight queries that return a value, which is then compared to the required threshold. Check results are also logged in the history table. For example, the Disk Space Free alert is as simple as:

In order to define the check, all we need to do is to create the query that must return a single value. In this case, this is:
select @output=min(free_space_percentage)
from dbo.vw_sqlwatch_report_dim_os_volume
where sql_instance = @@SERVERNAME
and free_space_percentage is not null
And define thresholds. In this case, we want a warning when the free is below 10% (0.1) and a critical alert when it drops below 5% (0.05). Optionally we can also define non-standard frequency. In this case, it is 60 minutes.
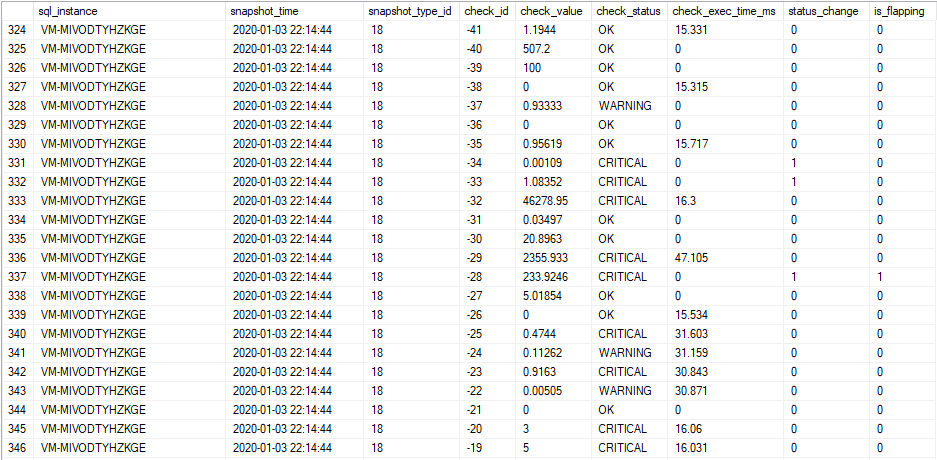
Results are stored in the table:
Actions
The next phase in the “check lifecycle” is an action. This step is optional as we do not have to have an action for each check. When a check goes from an OK state to a non-OK state, it can trigger one or multiple actions.
Actions are code templates executed by the PowerShell subsystem and therefore can span beyond the possibilities of a SQL Server Engine. They are primarily used to send notifications but can also interface with HTTP APIs, send emails, save files, do pretty much anything that a PowerShell can do.
Actions can also be executed from a report instead of a check.
For example, we can send email notifications using the T-SQL engine:
exec msdb.dbo.sp_send_dbmail
   @recipients = '[email protected]',
   @subject = '{SUBJECT}',
   @body = '{BODY}',
   @profile_name='SQLWATCH',
   @body_format = 'HTML'
Use PowerShell to send an email notification instead:
Send-MailMessage `
   -From 'DBA <[email protected]>' `
   -To '[email protected]' `
   -Subject "{SUBJECT}" `
   -Body "{BODY}" `
   -SmtpServer "smtp.yourcompany.com"
Interface with HTTP API to send Pushover push notification to mobile:
$uri = "https://api.pushover.net/1/messages.json"
$parameters = @{
   token = "YOUR_TOKEN"
   user = "USER_TOKEN"
   message = "{SUBJECT} {BODY}"
}
$parameters | Invoke-RestMethod -Uri $uri -Method Post
Save file to disk:
"{BODY}" | Out-File -FilePath \\yourshare\Folder\trigger.datSend data to Azure Log Monitor:
Invoke-Sqlcmd `
   -ServerInstance localhost `
   -Database SQLWATCH `
   -Query "{BODY}" `
| C:\SQLWATCHPS\Upload-AzMonitorLog.ps1 `
   -WorkspaceId YOURWORKSPACEID `
   -WorkspaceKey YOURWORKSPACEKEY `
   -LogTypeName "{SUBJECT}" `
   -AddComputerName
You can see an example Azure Workbook visualising Log Monitor data pushed from SQLWATCH here: Azure Log Monitor
Action templates
You may have noticed in the examples above a couple of variables: {SUBJECT} and {BODY}. These are substituted with values from the check and are fully customisable, defined by the action template.
You have full control over how the notifications look and what goes into the {SUBJECT} and {BODY} fields and can have different content going into email notifications and push notifications.
Flapping protection
Flapping happens when a check changes states frequently and goes from OK to non-OK (WARNING, CRITICAL) and back to OK. This usually indicates that the thresholds are not correct and on the edge of normal values, or that the service is very unstable. When flapping checks are detected, actions are postponed to avoid numerous notifications to send and a warning message is raised in the application log.
Reports
Reports can be run on a custom schedule, for example daily or weekly environment overview or backup reports, or can be run as part of a check and included in the notification. Reports can be as simple as a query automatically converted to a table or complex T-SQL returning complete HTML code. Reports also call actions.
Process Flow