Starting with version 2.2 it is now possible to send data collected by SQLWATCH to Azure Log Monitor.
Whilst it was always possible to push SQL Server related Performance Counters using the Azure Monitoring Agent, it was not possible to send any data residing in the SQL Server itself i.e. Dynamic Management Views (DMVs) metrics.
The Benefit
This change utilises the SQLWATCH Actions Engine and is able to send deltas every few minutes directly to Azure Log Monitor. Once data lands in Azure, we can use Azure Notebooks for data visualisation, leverage Azure itself for availability monitoring and get alerts when servers do no upload data on time. With this change, we can have truly decentralised monitoring with highly available, centralised reporting and alerting and never worry about SQL Agent having to actually work in order to send notifications. No complex configuration required, automatically upload deltas. Every 10 minutes by default.
Another benefit is that the pushed data is already denormalised and “human-friendly”. SQLWATCH is doing all the value and delta calculations and the Azure Log Monitor queries are very simple and do not require many resources and different joins.
As of January 2020, Azure Log Monitor offers a free tier of 5GB data ingestion per month and 30 days retention periods. https://azure.microsoft.com/en-gb/pricing/details/monitor/ which is enough to send data from a bunch of servers and leverage Azure Monitoring completely for free.
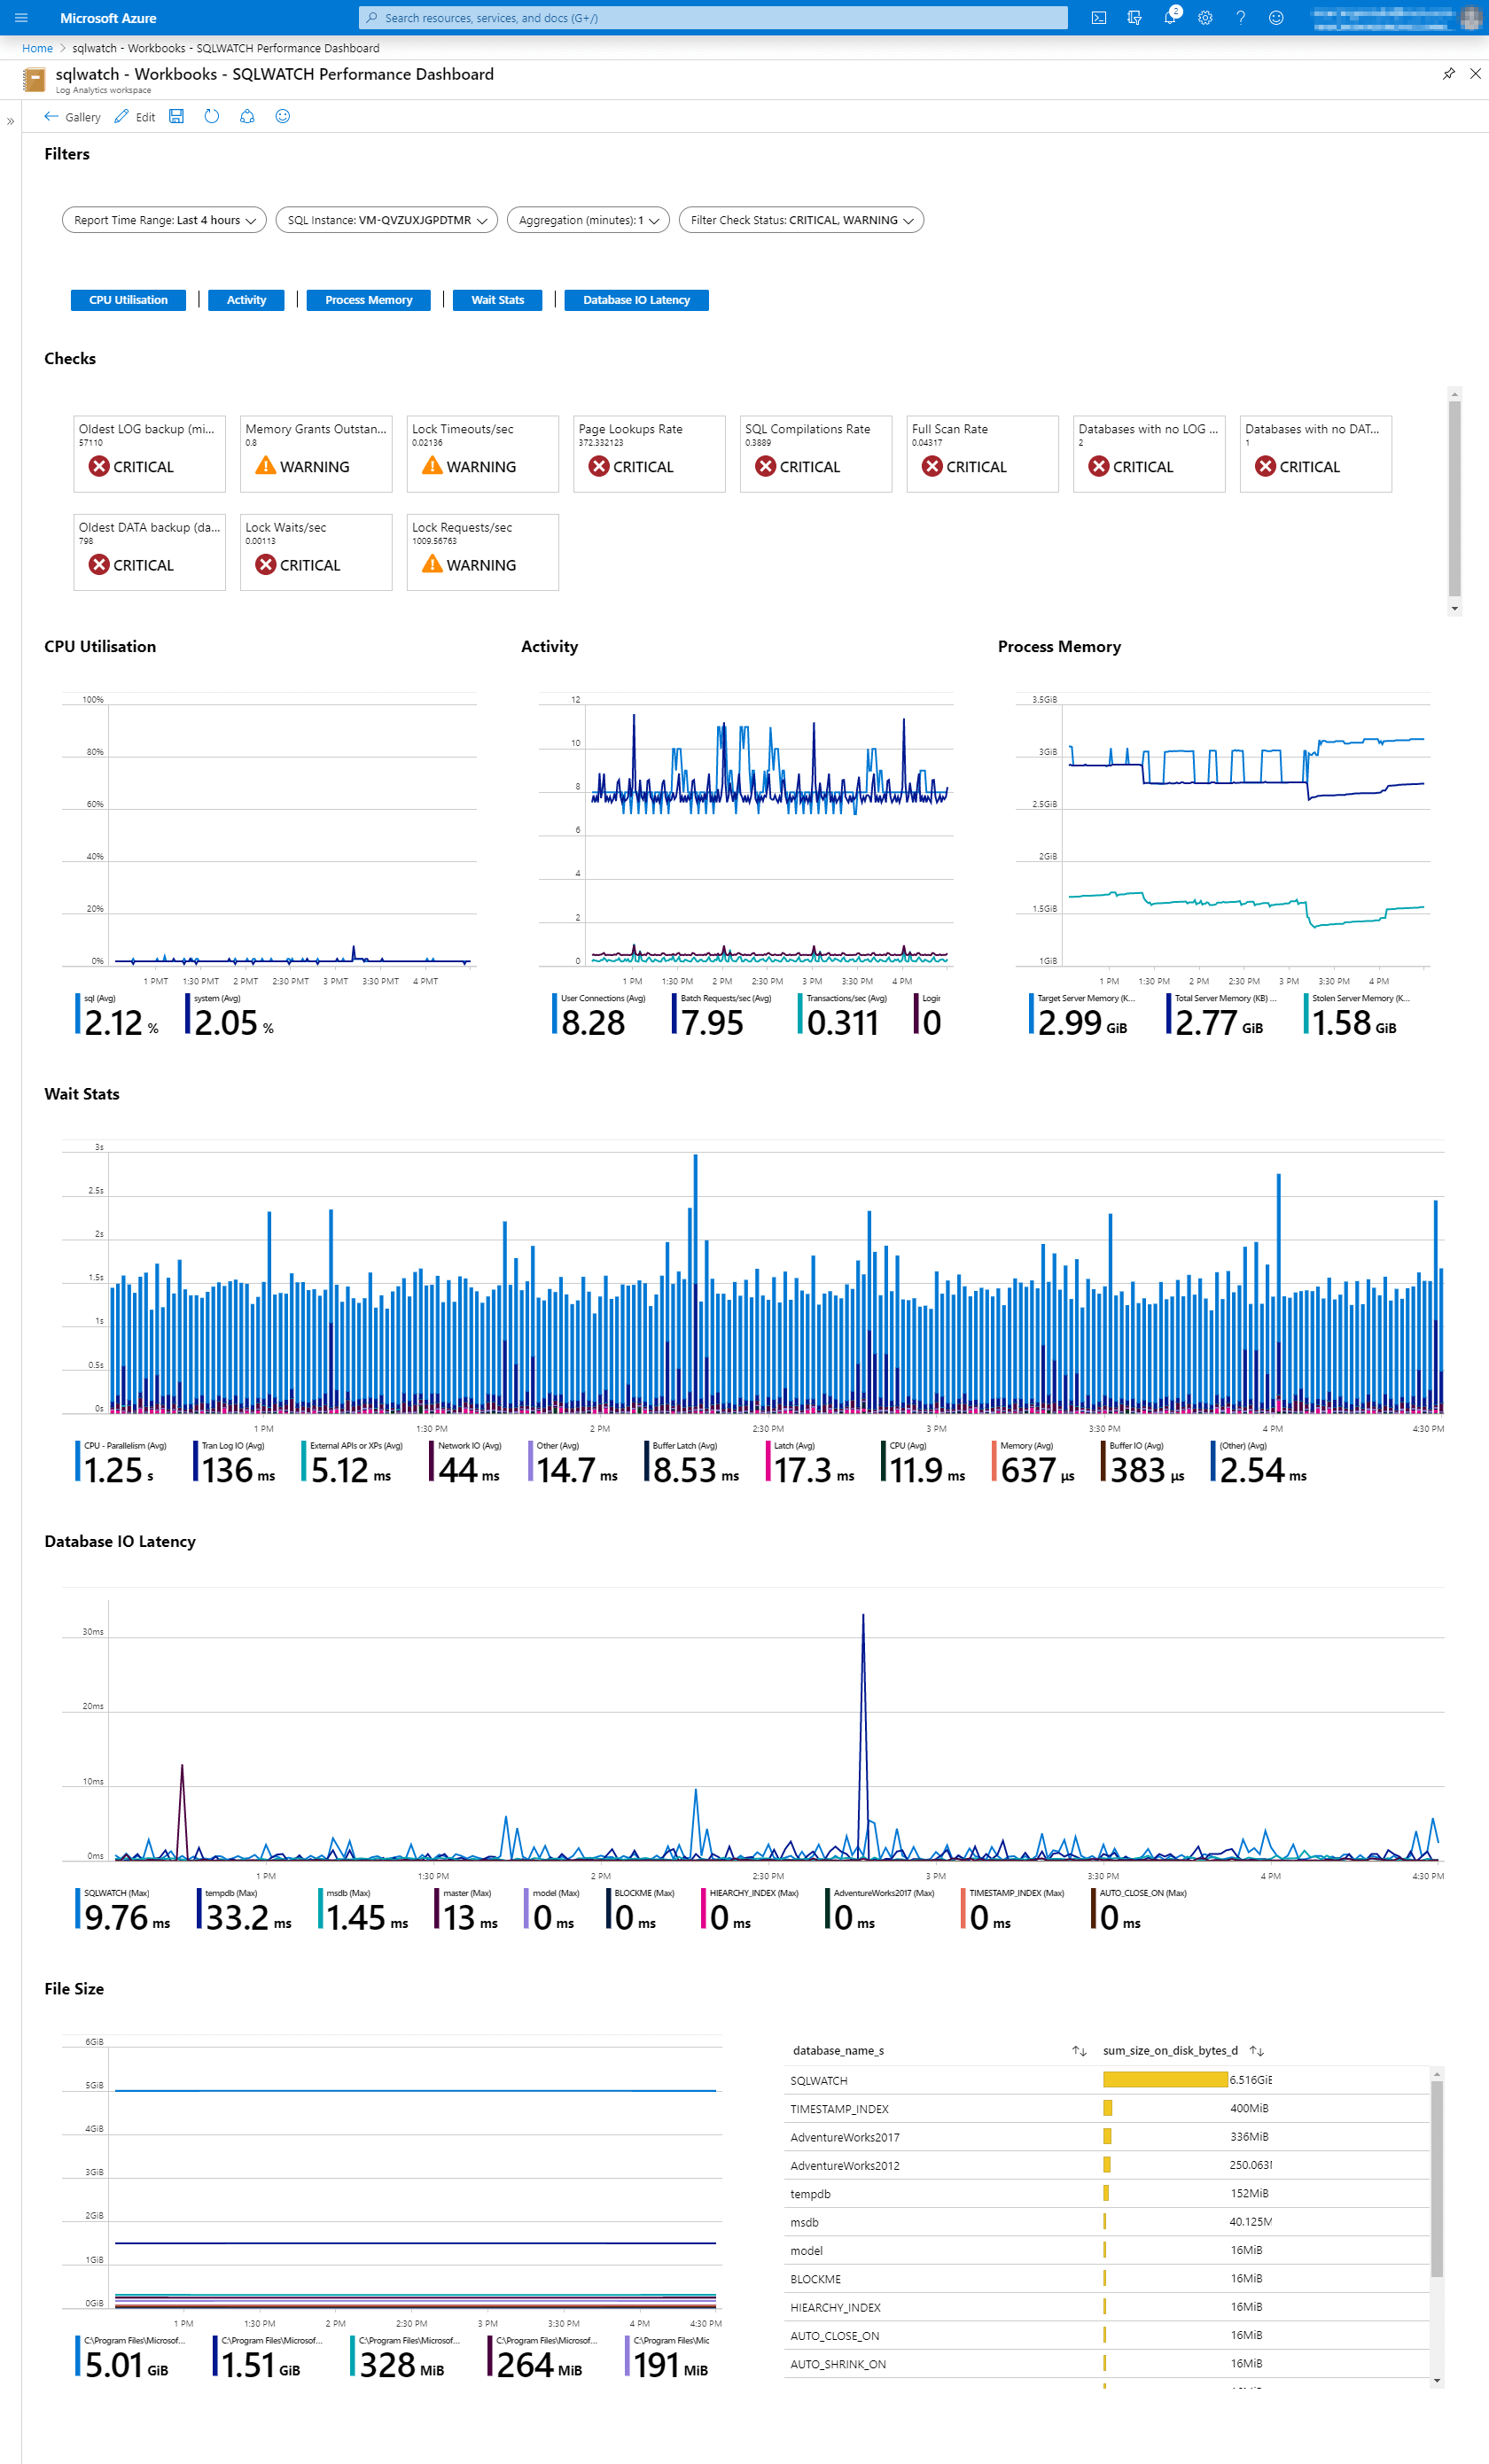
The below screenshot shows a very simple example of Azure Workbook which works on the same principle as the Power BI Dashboard, i.e. we can specify periods of data to show and aggregation periods for the data we would like to analyse
Azure Workbooks